In the June 2012 edition of Windward is an article about online sources of weather. The article is repeated below with all the appropriate weblinks, so that you can navigate direct to the websites.
There is also an additional section about websites for weather observations.
Sailing, great sport that it is, can be a little hamstrung by the weather. If you are anything like me (in which case bad luck!) every time you are thinking of going for a sail you start watching the weather fanatically. Will the sun shine? Will the wind blow a perfect force 3-4? Will the wind be on the beam for the whole passage? The answer to all these is invariably no – we do after all live in the UK! However, we do want to know what the weather might do and we have a wealth of information available to us these days. In fact the biggest problem with weather forecasting now could be argued to be that there is too much around and we don’t know which are best. Look hard enough and you may find a more promising forecast, but be prepared to be disappointed when you actually go out.
So – what are the best sources of weather? I have found that the best bet is to find a set of forecasts that you can assess over a period of time and therefore get to know and trust. There are of course the more traditional sources of forecasts; the shipping forecast and the inshore waters forecast. You can now get hold of these in various ways:
- On Radio 4 though you may need a case of insomnia for two of the broadcast times – 0048 and 0520! You will need a radio with long wave for the other two times 1201 and 1754
- Online – all the weather forecasts are available now on the met office website
- Via a Navtex receiver if you have one
- Via the VHF through the local Coastguard – see the almanac for the times and channels for this service
However, more recently a number of good quality websites have sprung up to offer detailed forecasts. Two of the most widely used are:
- Windguru and
- XC weather
Both these sites use the US GFS model for forecasting. The GFS model gives forecast data in the form of a grid of points at ½ degree (~50km) intervals. The websites interpolate this information to give a forecast for each location. This will not directly take account of local topographical effects, but does offer a useful level of detail. I find it valuable to look at the forecast before going out and then check it afterwards to see how accurate it was. I have tended to find that Windguru under-forecasts a little but you may have had different experiences.
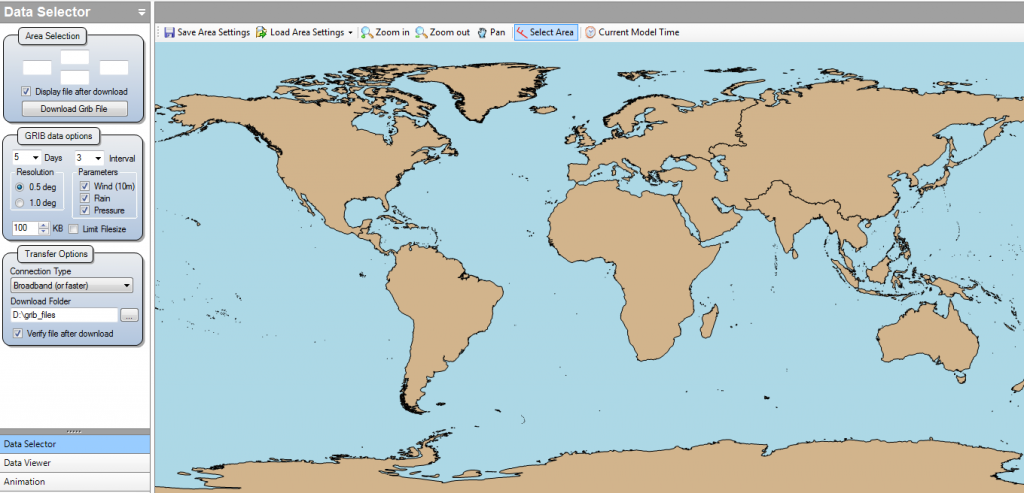
A particularly good tool for planning in relation to the weather is a free piece of software called UGrib. If you follow the ‘downloads’ link from the UGrib website, you can download the software quite rapidly, though you do have to register to download it. Once you have installed the software and started it up, you will be faced with a map of the world.
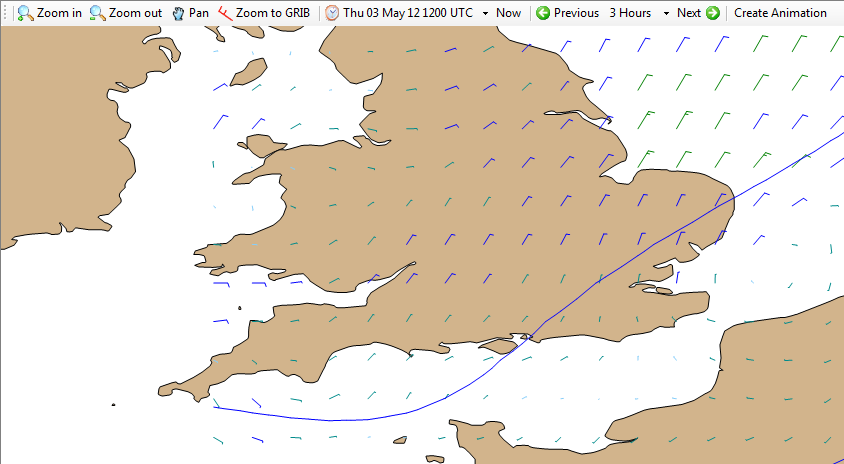
You can select the area you want a forecast of and then download the grib file. It will only take a minute or two to download and this will give you a forecast for the following five days and you can view it step by step. You can even view it as an animation. The forecast is shown as wind barbs. See the screenshot for an example.
The great thing about Ugrib is that you can also see the isobars and pressure systems and so can interpret the forecast. You can keep downloading forecasts for different areas to get a better overview. You can then save the areas you select so you can go straight back to them the next time. Free software and free forecasts – who said there was no such thing as a free lunch ?
Weather observations
All this gives forecasts, but what about what is happening now? We are lucky in having a series of weather stations based around the river and up the coast. These include ones at Dabchicks SC, Blackwater SC and Brightlingsea SC as well as the Walton and Frinton lifeboat station.
You can also check the weather by looking at the data from the National Data Buoy Centre. They maintain a database of observations from buoys and weather reporting stations all over the world. If you go to their website:
then you can narrow down the observations by clicking on the areas on the right. You can then click on individual buoys to get the data for them.
Other good sources of current weather observations include:
- XC Weather (click on the observations tab and then choose Wind or Visibility or Pressure ….)
- Met Office – observations
- Independent weather stations
There are various other sources of observations, but be sure to check their reliability before you use them in anger!
Andy Beharrell (http://www.charmary.co.uk)


